Operational dashboards

See where the problem is, and what it’s costing you.

Built from the spreadsheet your team already keeps, and run by the people already doing the work. No analyst to hire, no licence, nothing new to learn.

a dashboard engagement
Price€3,000 to €8,000, fixed before I start
DeliveryIn days, not quarters
Where it runsIn your environment, on your data
Try firstSeven live demos, with your own file
For operations, quality and finance teams in manufacturing, logistics, construction and services.
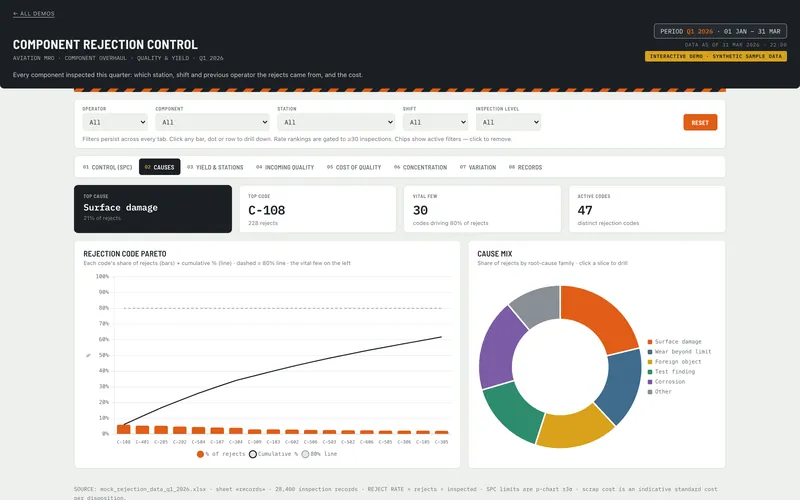
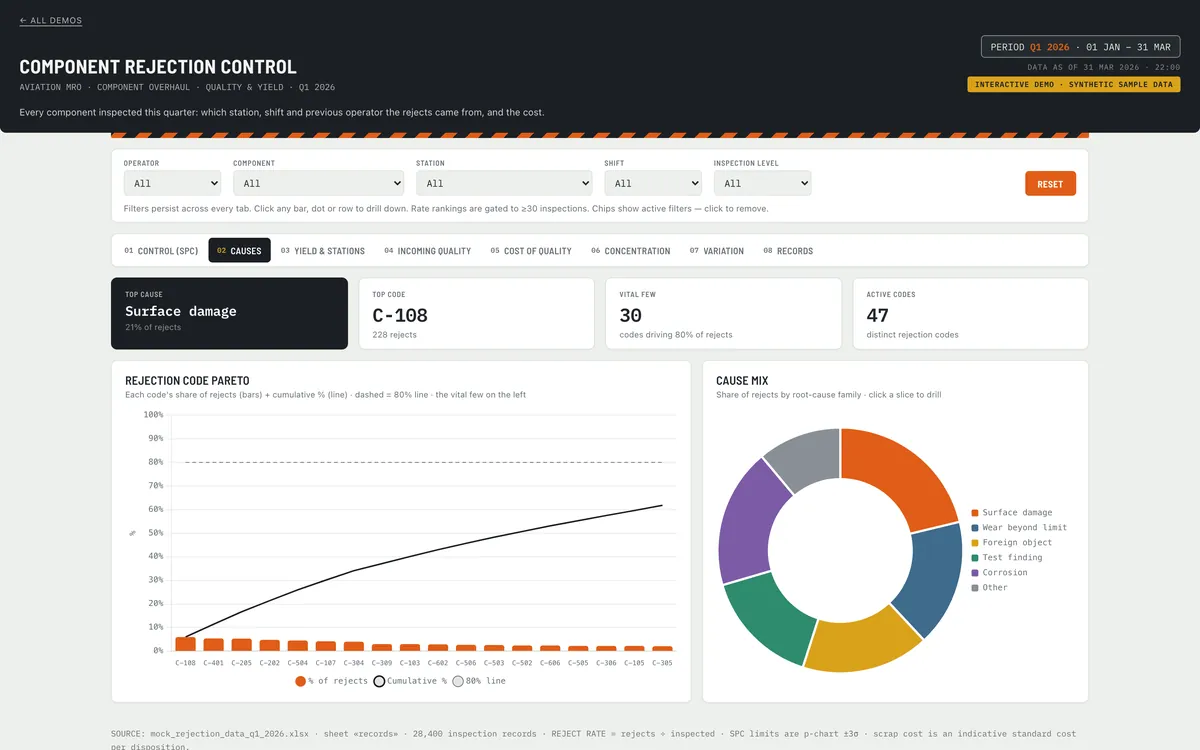
A quality dashboard: rejection codes ranked as a Pareto with a cumulative line, beside a donut breaking the rejects down by root-cause family.

Where this usually starts

None of these need a platform.

The same report rebuilt every Monday from the same export, out of date by Wednesday.

The reject rate moved, and nobody can say which station, shift or supplier moved it.

The ERP and the spreadsheet beside it disagree, so someone reconciles by hand.

“Which of these actually made money?” takes three days and a busy person.

The work

Open one. Put your own file in it.

Working demos on synthetic data. Not screenshots, not case studies. Each one ships the sample workbook it was built from. Change the numbers and watch the charts follow.

AviationQuality

Where the rejections come from

For a quality manager who has the scrap number and not the cause.

Rejection rates across a component overhaul line, split by station, shift and inspector. The weeks that breached control limits are marked, and the cost of each cause is attached to it.

SPC control chartCause concentration Yield by stationCost of quality
Open the demo →
WarehouseOperations

Where the queue builds

For an ops manager who knows orders are late but not which stage made them late.

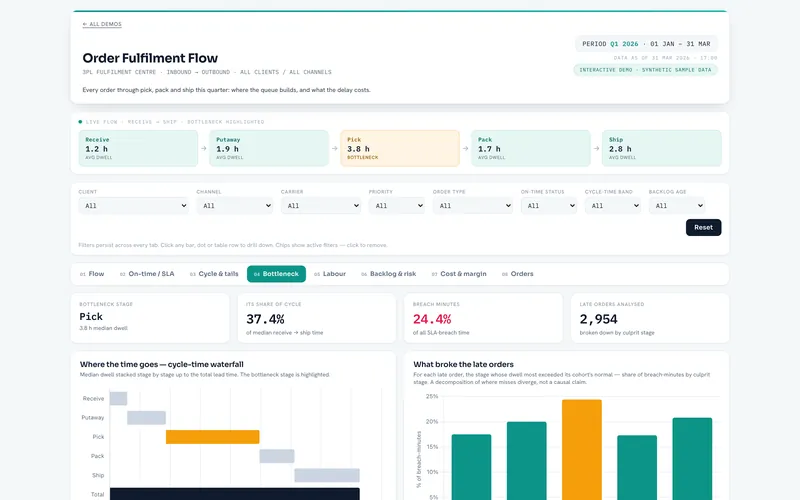
Order flow from receive to ship for a third-party fulfilment centre, with the bottleneck stage highlighted. On-time performance is broken out against SLA, and the long tail is shown rather than averaged away.

Bottleneck stageOn-time vs SLA Cycle-time tailsBacklog age
Open the demo →
ConstructionFinance

Whether the cash runs out

For anyone who needs to know which week the cash gets tight.

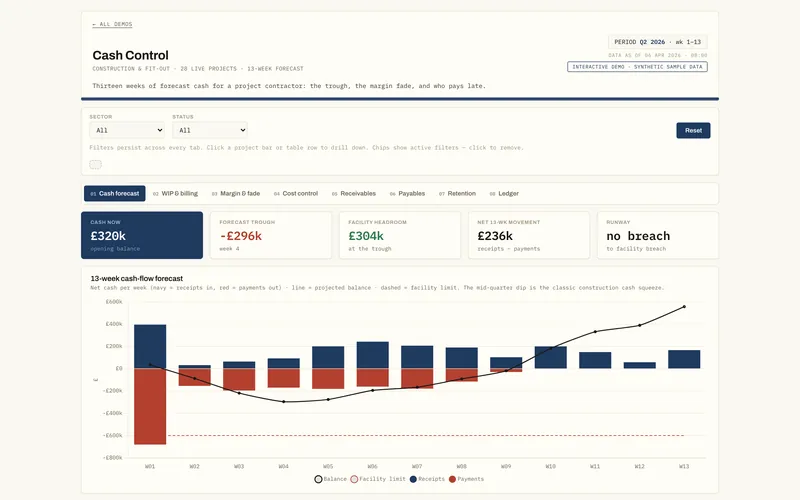
A thirteen-week cash forecast for a project contractor, with the trough marked. It also shows where margin is fading against budget and who is paying late.

13-week cash forecastWIP / over-billing Margin fadeDSO / DPO
Open the demo →

Where it runs

Your data doesn’t go anywhere.

One file, in your browser

It reads your spreadsheet locally: no upload, no account, no server of mine.

Works offline

Download any demo, disconnect from the internet, and it still works.

Nothing to approve

No vendor questionnaire, no procurement onboarding, no licence per viewer.

For your IT team

What a security review will ask, answered in advance.

Security & deployment

Questions I get asked

Does my data leave my environment? +

No. The dashboard is one file that runs entirely in your browser and reads your spreadsheet locally. There is no server of mine in the path, no account, and no upload step.

Don't take my word for it: go and try it. Every demo above has a “choose a CSV or XLSX” control, the list of columns it expects, and two download links: the sample workbook it was built from, and the dashboard itself. Download the workbook, change some numbers, drop it back in, and watch the charts follow. Then download the dashboard, disconnect, and do it again: offline, with the network tab recording nothing at all.

If we later automate the refresh, the job runs in your tenant on credentials you own, so the answer stays no. On the rare occasion it has to run on my infrastructure instead, I say so plainly, it goes in a data-processing agreement, and you see it written down before anything is built, never discovered afterwards.
What happens when my file changes? +

If the shape stays the same (same columns, more rows), you drop in the new export and it works. That's the point of building against the file you already produce rather than a system I've invented.

If the shape changes, or if dropping the file in every week has itself become the annoying manual step, that's when a scheduled refresh earns its place. It reads the source overnight and republishes. If a sanity check fails it keeps yesterday's good version rather than publishing something wrong, and it tells someone: a silently stale dashboard is the expensive failure.

Does someone on my team need to be technical? +

No. It opens in a browser and the filters work like a spreadsheet's. It is built around the file your team already produces, so the columns are the ones they named rather than ones I invented. If someone can read that file today, they can read this.

There is no analyst to hire, no per-seat licence, and nothing to administer. The people who already do the job are the ones who use it, which is the point of keeping it this small.

What if you disappear? +

Then you keep everything and nothing stops working.

  • It runs on your infrastructure, on credentials you own and can revoke without asking me.
  • You have full source rights and the actual source, not a compiled artifact and not a licence to something I keep.
  • The code is documented, the delivered version is tagged in a repository you hold, and anything automated comes with a runbook for when an alert fires.
  • There's no subscription to lapse and no per-viewer licence to renew.

A single consultant is a real risk, and it deserves a structural answer rather than a reassuring one.

How is this different from a BI platform? +

Mostly in scope and speed, and it's a fair question rather than a dig at the tools. Power BI, Tableau and Looker are good at what they do.

The differences that tend to matter: the same answers in days rather than a quarter; no per-viewer licensing, so sending it to forty people costs the same as four; it runs offline and from a file share; and there's no platform to administer or stay subscribed to.

The honest limit: for some cases (many sources, streaming data, multi-gigabyte volumes, a lot of people writing back) you genuinely do need a real platform. When that's your situation I'll tell you so rather than sell you a clever single file that falls over in a year.

How much does it cost? +

Fixed price per engagement, agreed before the work starts. Most first engagements land between €3,000 and €8,000 depending on how many sources are involved and how clean the data is. If yours is likely to fall outside that, I will say so on the call rather than after.

The exact number comes after a call and a look at a sample file. There is an optional monthly retainer afterwards if you want ongoing changes, and the deliverable keeps working whether or not you take it.

How a dashboard engagement works: delivery shapes, pricing and what you own at the end →

Send me one export.

The file someone rebuilds a report from every week. I'll tell you what is answerable from it and what is not, and where the data is too thin to support a chart. No call, no pitch, and it's free.

Not comfortable sending a file to someone you have not met? Send the column headers, a screenshot with the numbers blanked out, or two lines describing it. That is usually enough for me to tell you what is answerable.

Send me one file →

Or write to me here. A file helps, but a question is enough.